How were people in metropolitan Kansas City feeling before the COVID-19 pandemic hit our region? How might their perceptions change as they react to the tumultuous events of 2020? The newly redesigned Greater Kansas City Quality of Life dashboard will help to answer those questions. Based on surveys conducted by the Ewing Marion Kauffman Foundation in January of each year, this tool provides data to help users understand how residents from a wide variety of demographic groups perceive their quality of life and how those perceptions are changing over time.
This initial version of the new dashboard focuses on data from the 2019 and 2020 surveys, taken in January of each year. As such, they provide a benchmark for quality-of-life perceptions before the COVID-19 pandemic, the resulting lockdowns and recession, the protests in response to the murder of George Floyd by police in Minneapolis, the sharp-but-still-incomplete economic recovery and a highly contested presidential election. Once the January 2021 survey is conducted and tabulated, we will be able to assess the degree to which these events have affected Kansas City area residents’ perceptions of their quality of life over the past year.
While MARC has published results of the Greater Kansas City Quality of Life surveys in prior years, this is the first time the analysis and visualizations allow users to easily see how residents’ answers have changed compared to the previous year. What were the statistically significant changes in their perceptions of quality of life for themselves and in their communities and the region during the runup to 2020? Some findings include:
- When thinking about their quality of life, the proportion of residents selecting “family’s health and safety” as the most important consideration increased by 8 percentage points between 2019 and 2020, to 34%.
- Consistent with this, more residents chose “crime/violence/safety” as the community issue that most directly affects their quality of life. It too was up 8 percentage points between 2019 and 2020, to 21%. Parallel to this was a small but statistically significant decline in the percent of residents who feel safe in their home during the day (from 91% to 88%).
- Despite concerns about crime and safety, nearly three-quarters of residents (74%) felt the Kansas City region was moving in the right direction in January 2020, up a very significant 12 percentage points from the year prior.
- Also, the percentage of residents who thought “most people can be trusted” increased significantly, from 36% to 44%, between 2019 and 2020.
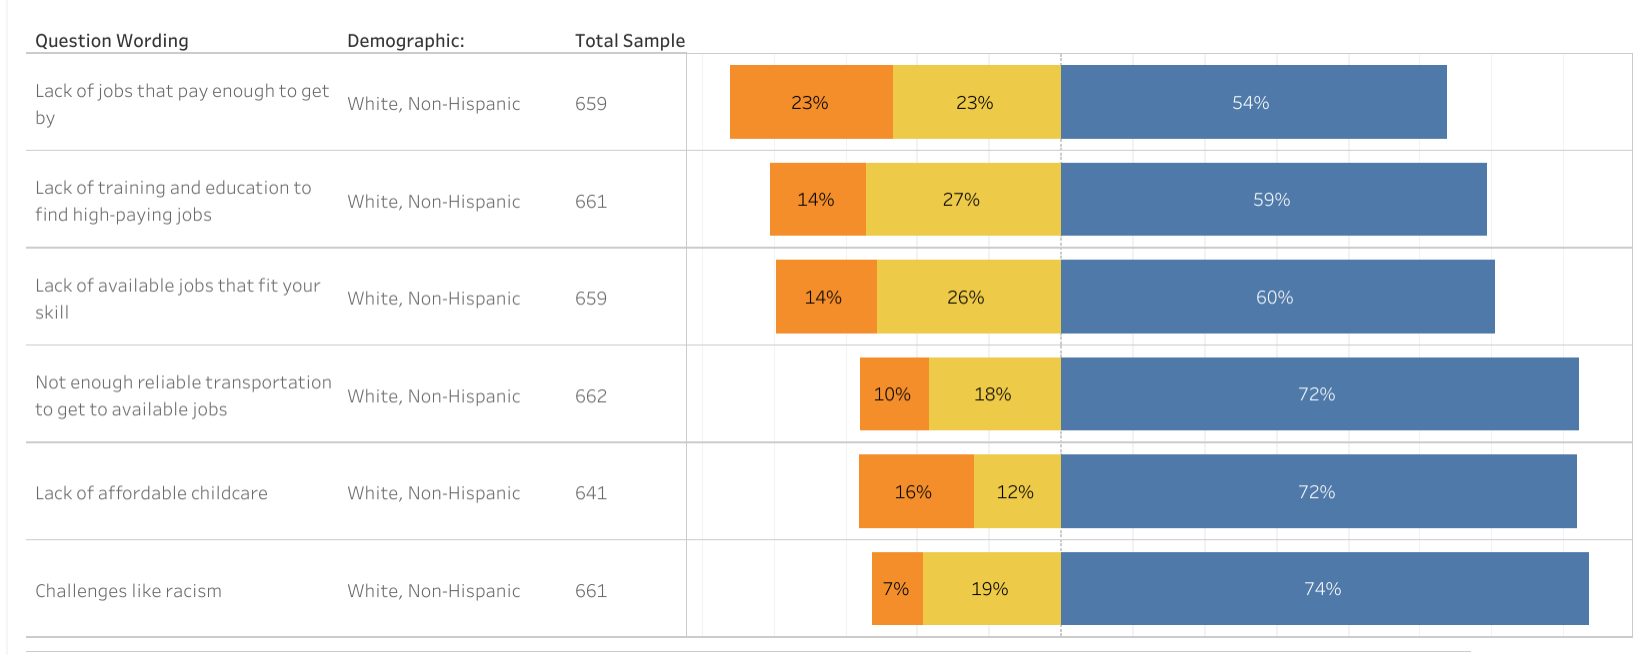
There were a few new questions on this survey where comparisons to 2019 are not possible. Comparisons across demographic groups are, however. For example, one new question asked about challenges to improving one’s personal financial conditions. The differences between how white and Black respondents answered this question are striking:
How much of a challenge are each of the following when it comes to improving your own financial situation?
White respondents:
Black respondents:
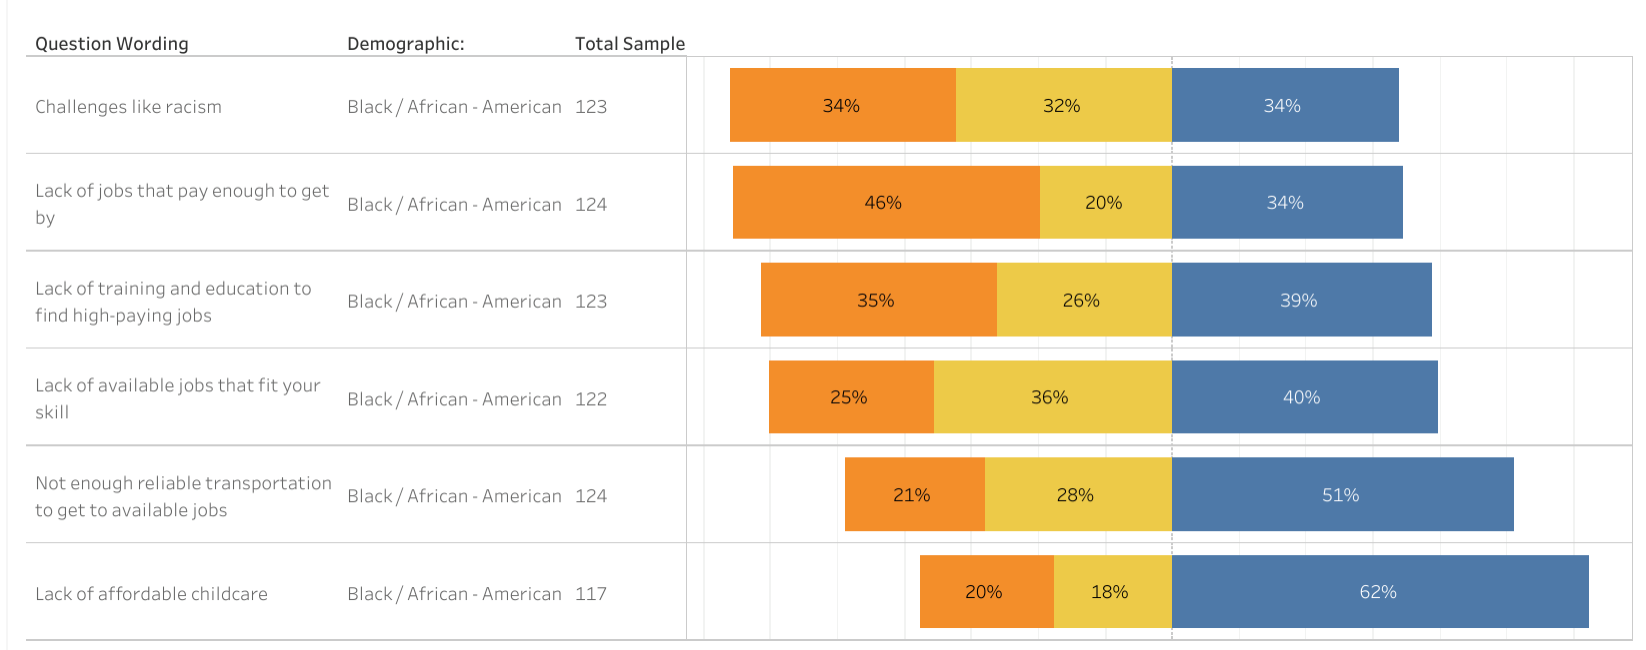
Racism poses the least challenge for white respondents seeking to improve their incomes, selected as a challenge by only one-quarter of respondents. By contrast, racism is challenge for two-thirds of Black residents. The ranking of the remaining challenges are identical between Black and white residents, with lack of jobs that pay well, lack of training to get well-paying jobs and lack of jobs that fit your skill level being the most often chosen. However, the percentage of residents facing those challenges is not. Almost uniformly among these challenges, the percentage of Black residents facing one of these barriers to earning higher incomes is 20 percentage points larger than that of white residents. The exception is affordable childcare, where the gap is “only” 10 percentage points.
Tabulating responses by demographic group is possible for every question simply by selecting the question and then the group of interest, such as age, gender, race, income or level of education. The selection can then be further refined by filtering by particular categories within each demographic groups, such as respondents between the ages 18-24 or those with a high school education. More detail on how to use the site can be found here.
With results generally available for available 26 questions in two survey years across 10 demographic groups, each with several sub-groups, the report provides a very rich resource for understanding how Kansas City area residents view their quality of life. There is too much information to be simply summarized. As a result we will periodically update this page to highlight results that may be of general community interest given the issues being discussed. We hope this helps make the data more useful and understandable in a way that encourages more businesses, governments and civic institutions to ask, “What does the Quality of Life Survey say?” before making investments and decisions.